Dashboard
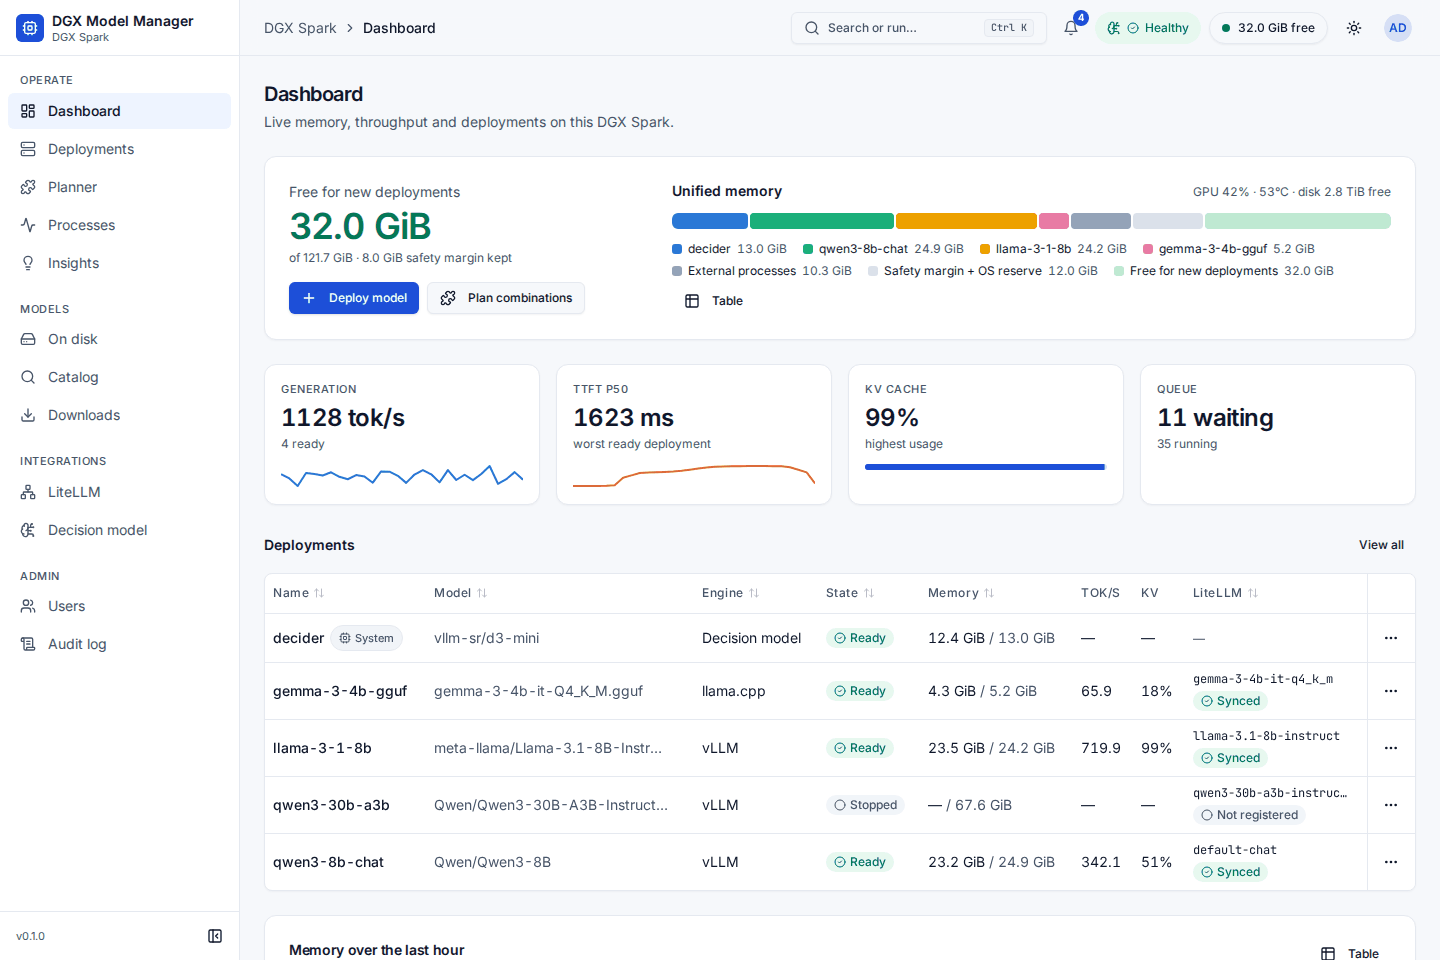
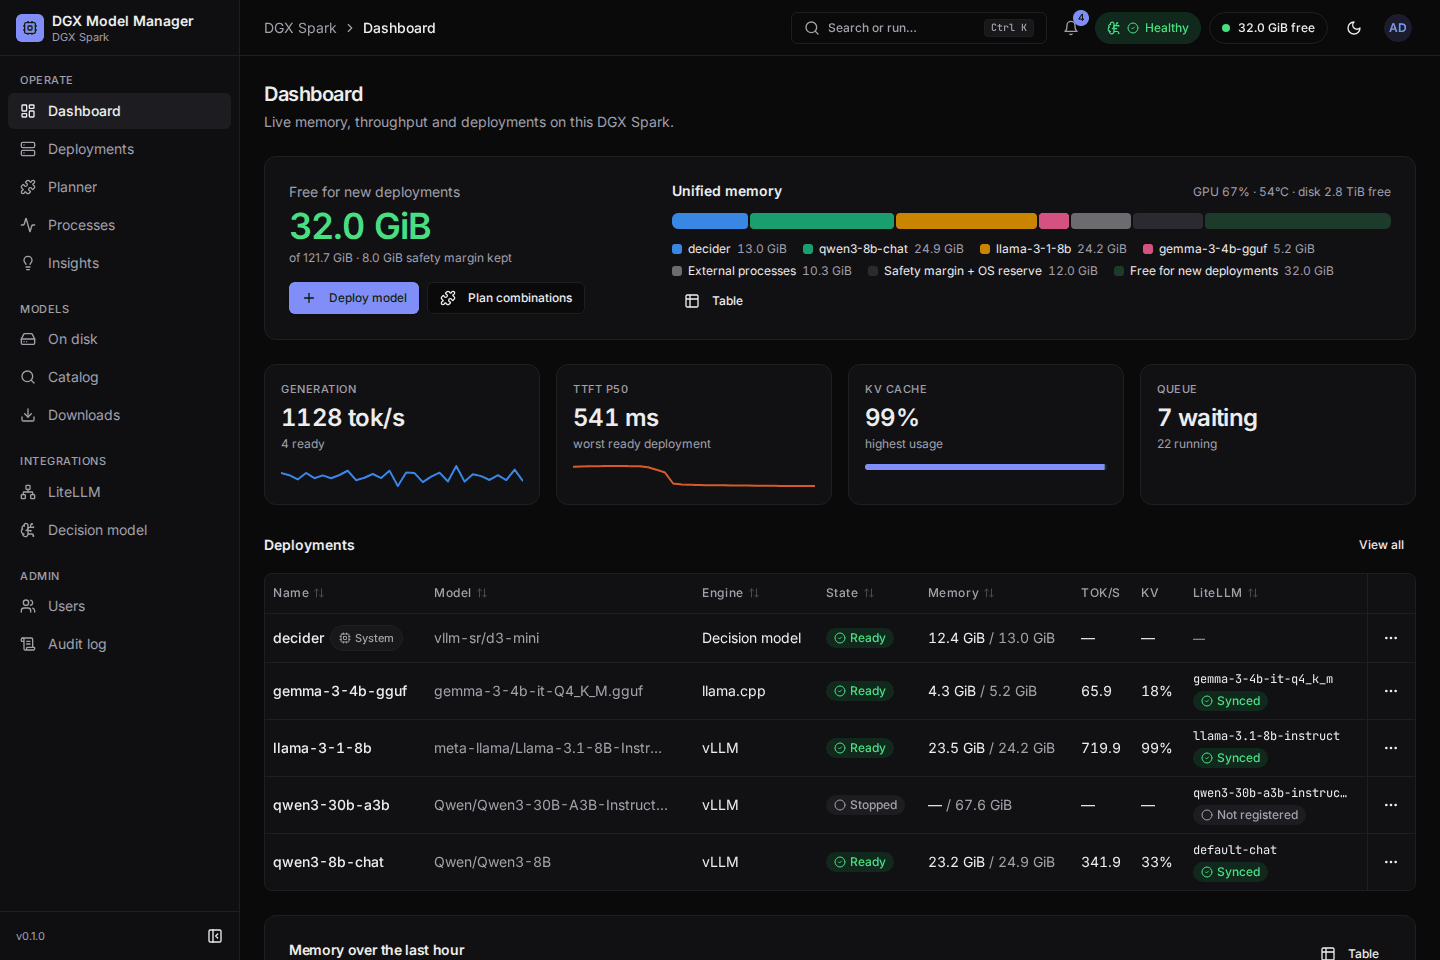
- Free for new deployments is the headline number: memory a new model may use right now, after the safety margin and OS reserve, what running deployments have reserved, and what other processes use (see memory model). The same figure is in the top bar on every page.
- Unified memory bar: one segment per DGXMM deployment, external processes, safety margin + OS reserve, and free memory. It also shows GPU utilisation, temperature and free disk. Table shows the same numbers as a table.
- KPI tiles: total generation throughput, the worst time to first token (p50) among ready deployments, the highest KV-cache usage, and the request queue.
- Deployments table with state, memory (measured / reserved), tok/s, KV usage, and the LiteLLM model
name with its registration status. When a ready deployment is not registered (for example because
LiteLLM is unreachable or another deployment holds the same model name), the status has a tooltip
with the exact reason. A deployment waiting for its turn to start shows Queued with its position
(see the start-up queue). The decision model, when enabled, is listed with a
System badge. Row actions are in the
⋯menu. - The bell in the top bar shows how many insights are open; it opens the Insights page.
- Memory over the last hour chart, and the largest external memory users: processes DGXMM does not manage. Each row shows the container (or "host"), the pid and user, the command line (hover for the full, masked command) and the RAM / GPU split. DGXMM never touches these processes. View all processes opens the Processes page.
- Containers not managed by DGXMM (admins): vLLM containers started by hand. Adopt settings copies one's model and flags into a new, stopped DGXMM deployment. The original container is left alone: stop it before you start the adopted deployment.
A banner appears when memory runs low: warning below 1.5 × the safety margin, critical below it.